 Jim Apps
Slideporter: Power BI to PowerPoint with editable charts
Power BI exports each report page to PowerPoint as a picture. Slideporter is a PowerPoint add-in that inserts the same pages as native charts, tables and text. Change a color, fix a label or update a number right on the slide.
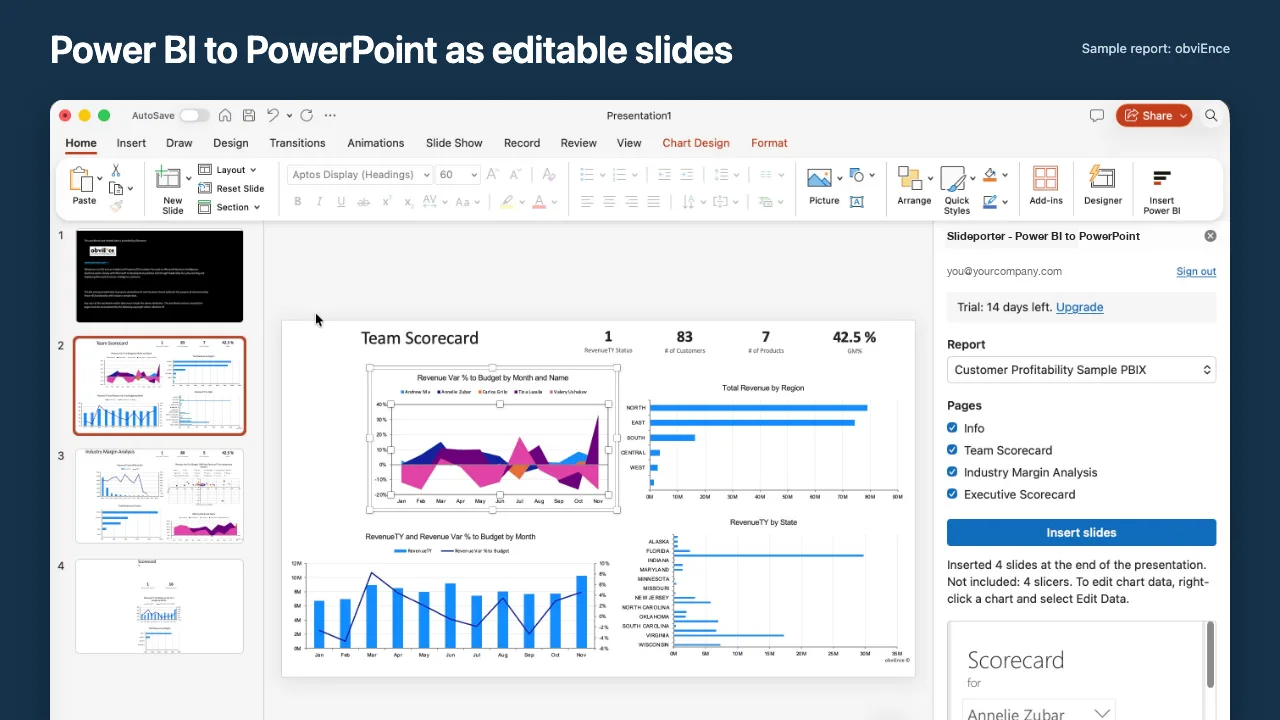
Export Power BI to PowerPoint: pictures or charts
Power BI's own export to PowerPoint places each visual as a picture, and the Power BI add-in from Microsoft shows a live report on the slide. Both are useful when the slide should look exactly like the report. Neither gives you a PowerPoint chart you can restyle to match your template, so teams end up rebuilding visuals by hand. Slideporter inserts the chart itself, with its data sheet inside the presentation.
What the Power BI add-in for PowerPoint inserts
| In the Power BI report | On the PowerPoint slide |
|---|---|
| Column, bar, line, area, pie and doughnut charts | Native charts with their data sheet |
| Column and line combo charts | Native combo chart with two axes |
| Scatter charts | Native scatter chart |
| Tables and matrices | PowerPoint table |
| Cards and text boxes | Editable text |
| Image visuals | Picture |
| Treemaps and maps | Bar chart with the same numbers |
| Slicers, shapes, buttons, custom visuals | Not inserted; the panel lists what it left out |
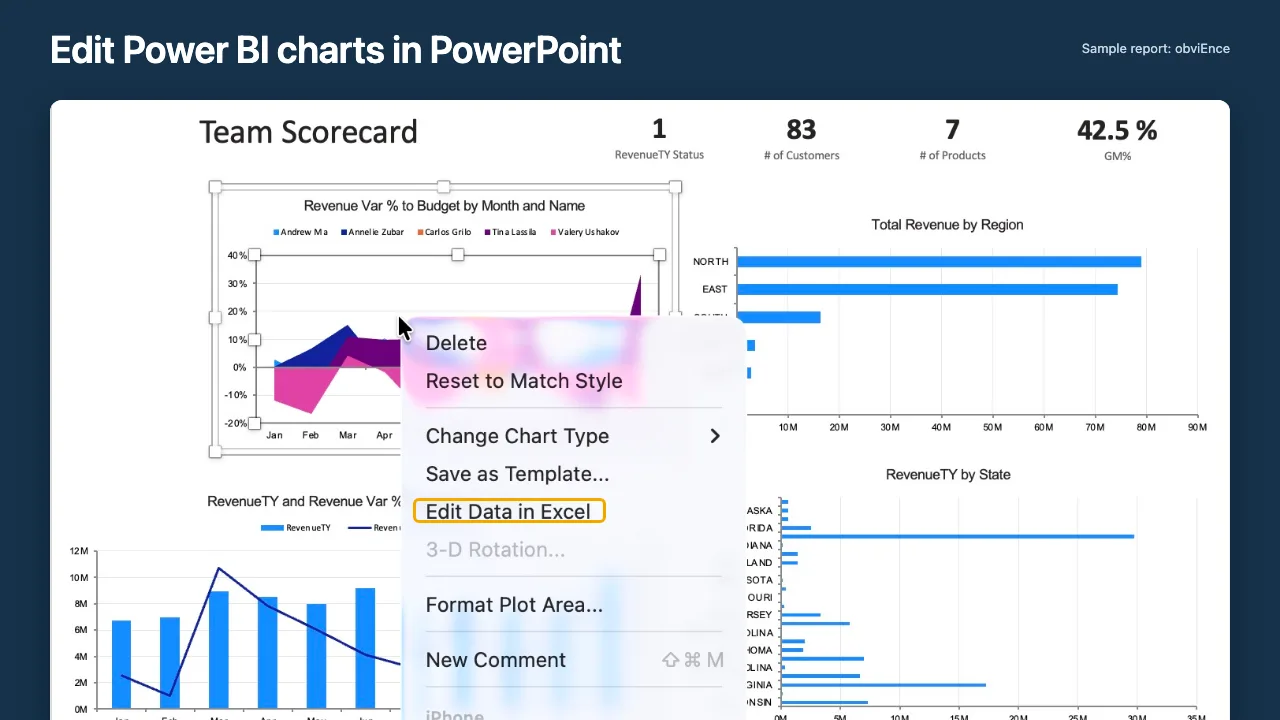
How to export a Power BI report to PowerPoint
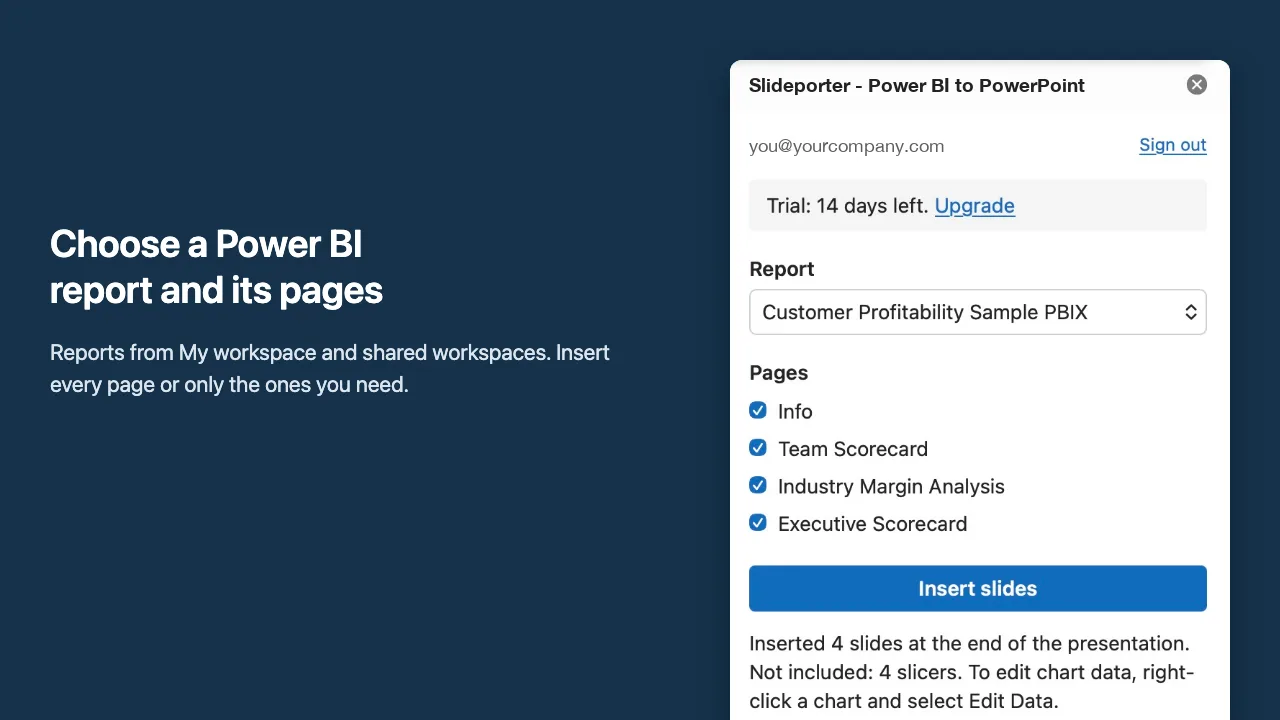
- Open Slideporter in PowerPoint Install it from Microsoft Marketplace, or in PowerPoint select Add-ins and search for Slideporter. On the Home tab, select Insert Power BI and sign in with your Microsoft work or school account.
- Choose a report and its pages Reports from My workspace and shared workspaces are listed. Insert every page or only the ones you need.
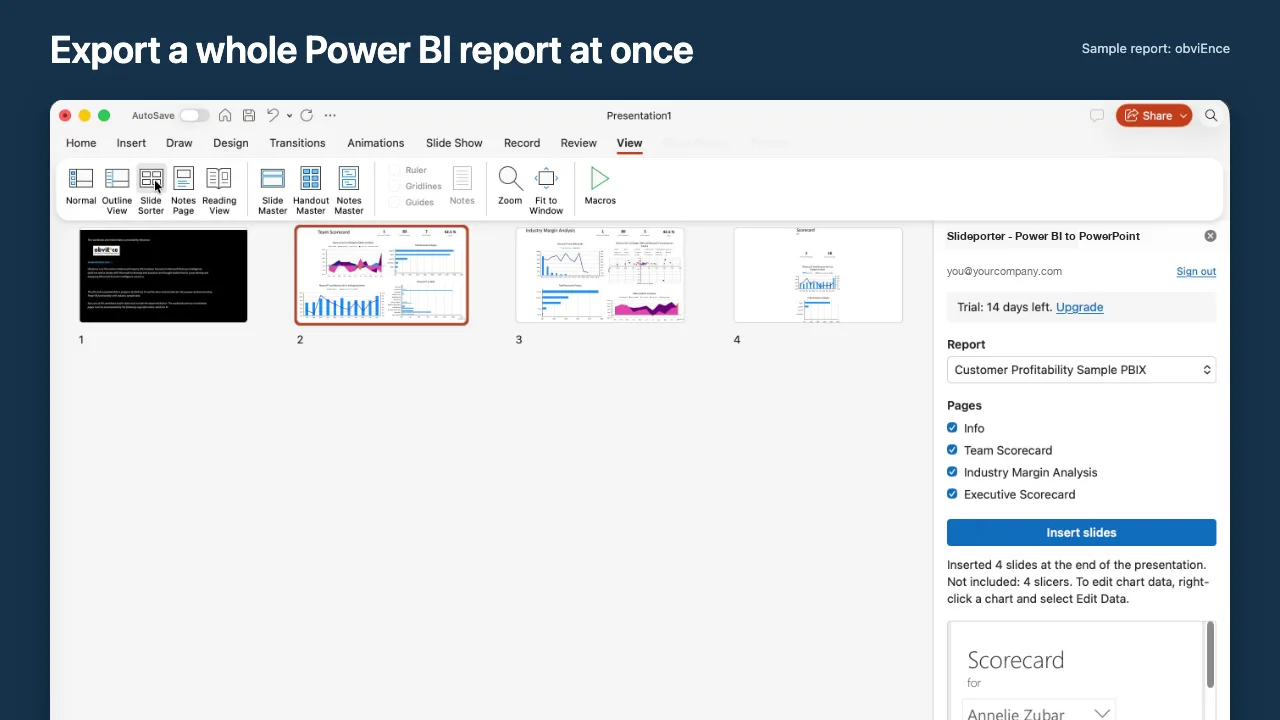
- Insert slides Each page becomes a slide at the end of your presentation, with every visual in the same place.
- Edit like any other slide Apply your template and colors. In PowerPoint on Windows or Mac, right-click a chart and select Edit Data to change its numbers.
Slideporter pricing
| Period | Price | Includes |
|---|---|---|
| First 14 days | $0, no card | Every feature. The trial is tied to your Microsoft account. |
| After the trial | $15 / month or $144 / year per user | Every feature. Slides you already inserted stay yours when a trial or subscription ends. |
Payments are handled by Paddle. Pricing details.
Honest limits of Slideporter
- Chart data is edited on the desktop Changing a chart's numbers needs PowerPoint and Excel on Windows or Mac. PowerPoint for the web shows the charts but cannot edit their data.
- A copy, not a live link Slides hold the data at the moment of insert. To refresh them, insert the pages again.
- Colors and fonts are not copied exactly Charts use standard colors, ready for your PowerPoint template, rather than the report's own theme.
- Up to 30,000 rows per visual This is the limit of Power BI's data export.
- Your admin's settings apply Your Power BI admin must allow exporting data from visuals. Text boxes and images also need permission to download the report.
Questions about Power BI and PowerPoint
- Can I copy a visual from Power BI to PowerPoint as a chart? Power BI copies a visual only as a picture. Slideporter inserts it as a native chart, one report page at a time or a whole report at once.
- Does my data go through your servers? No. Report data goes from Power BI to your presentation inside PowerPoint. We store your Microsoft account ID, the trial start date and your subscription status. See the privacy policy.
- Which Power BI license do I need? A free Power BI account works with reports in My workspace. Reports in shared workspaces usually need Power BI Pro or Premium Per User.
- Does it work with PowerPoint for the web? Yes, you can insert slides there. To edit chart data, open the presentation in PowerPoint on Windows or Mac.
Slideporter is made by an independent software studio and is not affiliated with or endorsed by Microsoft. Microsoft, Power BI, PowerPoint and Excel are trademarks of the Microsoft group of companies.